There are a number of case studies that have been conducted regarding website performance and how website speed affects user experience, click through rates and ultimately conversion rates – which is what we’re really after. In this article, we’re going to look at data we’ve collected about sites on our platform and how they stack up against industry standards.
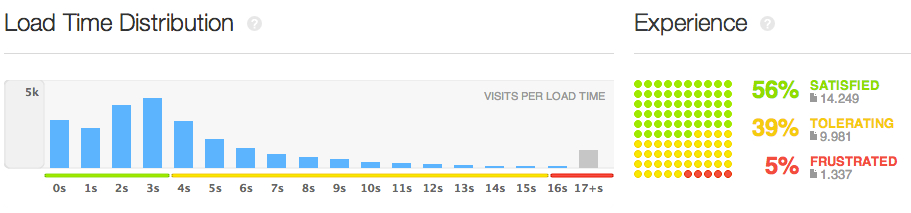
In the Web industry, user satisfaction with a website or Web application’s performance is often graded using the Apdex (Application Performance Index). This Index sets a standard for page load time and satisfaction thresholds which we use to analyze user satisfaction. As you can see below, pages that take more than 16 seconds to load will lead to a frustrated user.
Apdex Load Time Satisfaction Thresholds

We don’t exactly agree with this because we expect users to be extremely frustrated when pages take longer than 8 seconds to load. So, when we compare our results to the Apdex Satisfaction Thresholds, we usually just focus on the Satisfied metric.
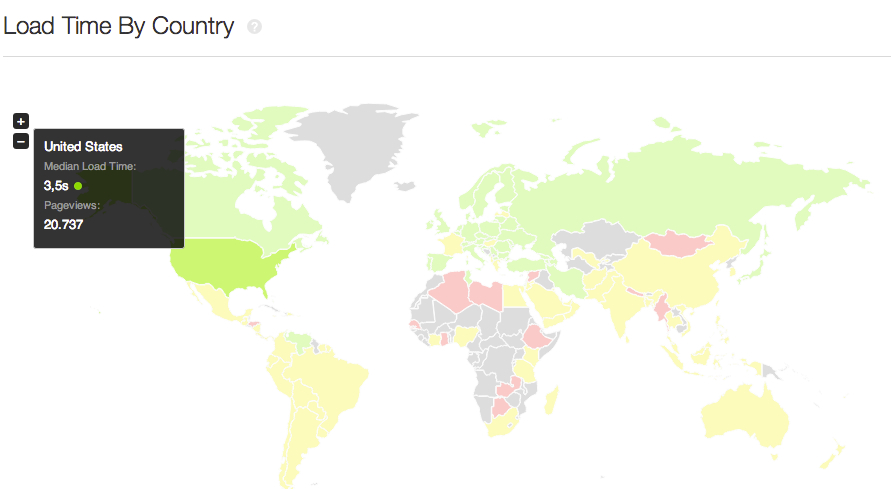
Digging into the data, we tracked over 25,000 visits to websites on the Pronto platform from all around the globe using Pingdom’s Real User Monitoring (RUM). The World Map below shows visits to our sites, made by real users, aggregated and scored against Apdex User Experience Metrics.
World map with User Experience by country
Load Time Distribution & User Experience Breakdown
Does server location affect website speed?
The most logical, and often first, question that comes up is about where our servers are located. Our primary infrastructure is located in London, UK with Rackspace, but a large portion of the traffic to our platform comes from North America. From the stats above, 84% of traffic comes from the US where the median load time is 3.5s.
This is a good number but, we also have websites from around the world. So, we did some more research to see if there is a difference between not only the East and West Coast of the US but also other global locations. To do this, we used WebPageTest.org’s different test locations across to get a world-wide average to compare with.
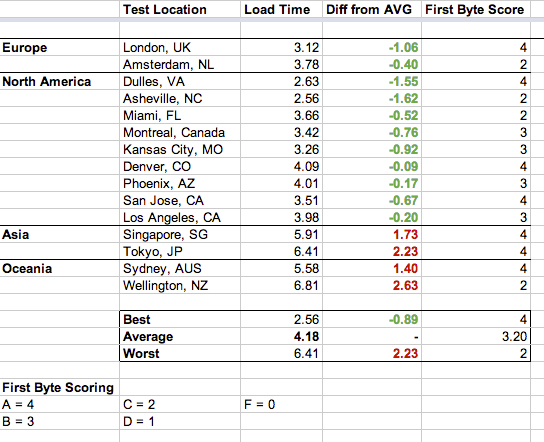
The test results above show similar data to that from Pingdom’s RUM. They also show that there is some latency (increased load times) for sites on our platform when accessed from Asia, Australia and New Zealand. This is most likely related to a combination of pure distance and the network infrastructure.
For example, the distance between London and Sydney is around 21,000 miles while the distance between London and San Jose is roughly 5,000 miles. This scenario of sites being slightly slower for the Oceanic region is actually quite common across all platforms unless there is dedicated hardware setup or hosting solution in the region.
The results for North America show that there is a small speed difference between the East & West Coast but some locations on the East Coast performed worse than the West, i.e., San Jose, CA is faster than Miami, FL. Overall on average, North America performed well with a maximum difference of page load at 1.5s despite the roughly 3,000 mile physical difference. Also, it’s quite interesting that some of the locations in the US outperformed London (Dulles, Asheville) and several others outperformed Amsterdam (Miami, Montreal, Kansas City, San Jose).
These results do highlight that there is a small level of correlation between physical distance and site page load times. However, physical distance doesn’t tell us the whole story given that locations that are further away dramatically outperformed closer locations. For example, Amsterdam is about 200 miles, and San Jose is about 3,000 miles away from London but San Jose was .26s faster on page load.
What matters to Google for search rankings?
A long, long time ago, Google used to look at server location as a factor for local SEO but this is no longer the case. Here is a great talk from Matt Cutts explaining how Webmaster Tools now handles this. To summarize, Google Webmaster Tools now have a feature that specifies your domain’s target geographic market – i.e., which country you want to rank in. Pronto sets up geographic targeting for all our websites during the production process.
Recently, articles are saying that Google calculates site speed as part of their ranking algorithm. A recent article published by MOZ thoroughly studied the algorithm to see how it actually works and how it affects search results. They collected and analyzed over 40 page metrics for over 100,000 pages and their findings show that there is actually a direct correlation between ranking results and TTFB (Time To First Byte).
In other words, MOZ found that Google doesn’t use page load times to influence page rankings, instead they look at TTFB. Their explanation as to why this is goes into great depth about why TTFB is not only easier but more logical for Google to use. This makes more sense for their ranking algorithm which in the end is optimizing results for the best user experience.
The TTFB Metric can be measured easily and is actually shown on each test done on WebPageTest.org as the First Byte Time with a grading scale. The example rating below covers a sample rating scale for a website.
WebPageTest.org Page Grades
If we take the scores from all of the data we collected on our pages from WebPageTest we would get an average TTFB of 3.20 seconds. Converting this to a standard letter-based grade results in our sites getting an average grade of B.
Looking closer at this data and comparing it to physical distance from the server and test location, you’d think that TTFB would gradually trail off to a lower score as distance from the host server increases, but this actually doesn’t hold true. For example, three of the furthest distances with the slowest total load times (Singapore, Tokyo, and Sydney) scored a TTFB of A. What’s more, the location with the fastest page load at 2.56s in Asheville, NC received a TTFB grade of B.
Some closing thoughts
In conclusion, there is a small measurable, yet almost unnoticeable difference in page load times depending on the distance from our main origin servers in the UK. Australia and New Zealand see the worst load times, partly due to the distance from from London, and also other known Internet infrastructure problems in the region.
By Apdex and user standards, almost all average page load times in North America are of satisfactory levels which is what we’ve been working towards. Along with server infrastructure, there are a bunch of other things that can be done to improve the performance of a web page, many include optimizations of JavaScript and total page size through image optimizations.
Looking forward
In recent months, our infrastructure team has been really focused on overall platform stability, origin server speed and overall resiliency to bot attacks on WordPress sites which have been a global issue. Over the next few months we’re going to be looking at ways for how we can address some of these fringe issues for better global performance in places that are underperforming today such as site speed for Australia and New Zealand. Stay tuned for updates as we continue to introduce improvements to your infrastructure and platform.