


We’ve recently been digging through our Google Analytics data to try and answer a question that we’ve posed to ourselves for quite a while now: How does a website’s traffic change after switching to Pronto? We have plenty of anecdotal evidence that most of our clients see improved results after switching to us, but Google Analytics doesn’t make it very easy to look at aggregated data on a large scale level. Thankfully, we have some tools and a few willing volunteers to help gather data from before our clients’ new sites went live and from several months after the switch.
The Google Analytics tracking code
As we started the first steps of this project, one thing became immediately apparent – most of our clients come to us without the Google Analytics tracking code installed on their existing site. Out of the 634 website included in our initial sample, only 111 had GA installed on their pre-Pronto website.
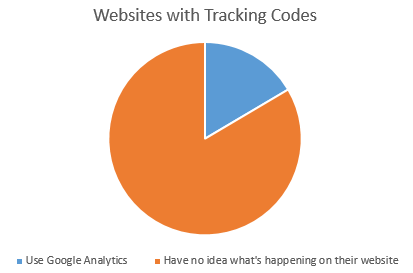
In other words, 83.5% of small businesses aren’t tracking traffic on their websites. That number astounds me. Sure, some of those sites might have been using something other than Google Analytics, but it’s very rare that we get a client asking about 3rd party tracking tools.
Web analytics is a crucial part of any online presence. So if you don’t have Google Analytics on your website, go get it. It’s free and it’s awesome.
Traffic data
Thankfully, the 111 sites with the Google Analytics tracking code installed provided enough relevant data for us to draw some conclusions. We started by collecting several crucial data points during the lifetime of a new Pronto website: 2 months before going live, the first 3 months after going live, 6 months after going live and 1 year after going live.
Let’s start off by looking at the average visits from all traffic sources to these sites.
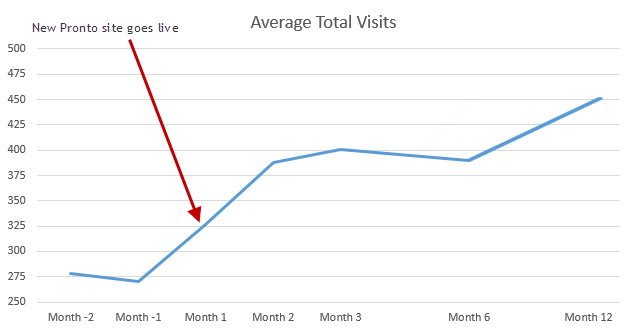
It’s pretty easy to see – our clients tends to see a huge increase in traffic after moving from their old website to a new Pronto website. On average, they see a 48.4% increase in the first three months and a 66.9% increase over the course of their first year with Pronto.
Those are some great numbers; however, they don’t tell the whole story. Some clients, perhaps, use online advertising platforms at some point during their lifetime with Pronto or maybe they launched a larger marketing campaign along with their new website.
While I’m sure working with Pronto contributed to this growth for our clients, there could many other reasons behind this increase in overall traffic. To get a better understanding of how Pronto websites perform compared to our client’s previous websites, we need to focus on organic search traffic.
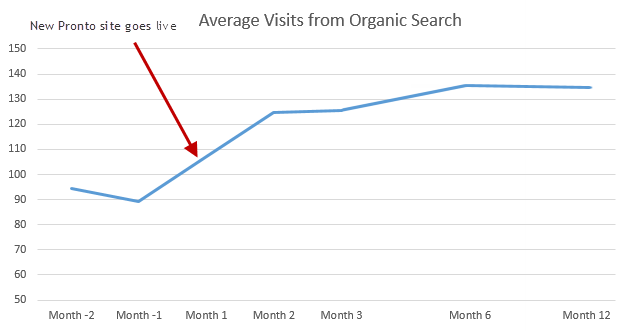
Here we’re able to get a clearer picture of how moving to Pronto benefits our clients. Over their first year with Pronto, our clients, on average, saw a 42.8% increase in traffic from search engines.
However, unlike the data from total visits, the majority of this growth occurred in the first 3 months. We don’t see that same spike in the 6-12 month range that we saw in total visits.
This makes sense with the type of SEO services we provide. Our SEO work focuses primarily on on-site optimization and local SEO. Since many of our clients come to us with these aspects of their SEO in complete disarray, it seems logical that having our SEO team clean these up and ensure that everything is well-optimized, resulting in big improvements over the first few months. Continuing that level of growth over longer periods would require SEO tactics outside of what we provide.
Engagement data
There’s more to judging a website’s performance than tracking the number of visits. In particular, we want to look at how users behave once they arrive at the site. Two of the most common metrics for measuring user engagement levels are Bounce Rate (the percentage of visits in which the user only views one page and then leaves the site) and Pages per Visit (the average number of pages viewed during a visitor’s session on the site).
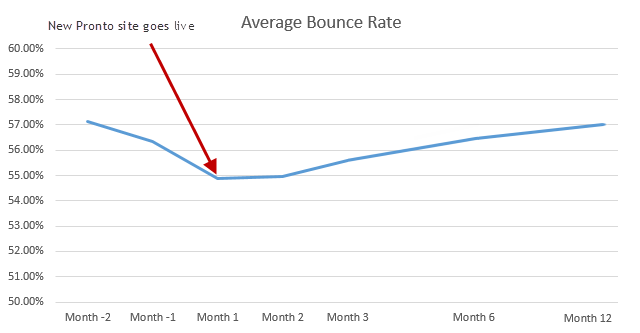
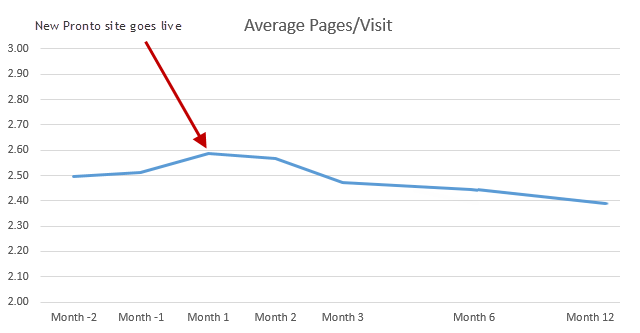
In both cases, we see an initial improvement at the launch of the new website that slowly whittles away over the course of the year. Without looking at more granular data, it’s hard to say what causes this slow decay, but in general, as websites receive more overall traffic, an increasing (although still small) portion of that traffic will be from irrelevant visitors.
The important thing to notice here is that from Month -1 to Month 12, the average Bounce Rate on our clients’ sites increased by just 0.69% and the average Pages/Visits decreased by only 4.8%. Over that same timeframe, the average total visits increased 66.9%, so while these graphs might look like engagement on these sites has deteriorated, the total amount of engagement has still increased.
Conclusion
It’s safe to say that, in general, our clients see a strong improvement after Pronto creates their new website, but keep in mind that the data is averaged over 111 sites. So these numbers don’t necessarily mean that your site will follow the exact same patterns.
There are a huge number of variables involved in the performance of any new website from the strength of the domain to the size of the marketing area to the level of competition in the vertical. If you’re interested in learning more, check out this article with some data on what it’s like to start a new website from scratch.